Jan 21, 2026
Jan 20, 2026
Signal to Noise Ratio
Paradromics’ scientists had the opportunity to present our latest preclinical research at the Society for Neuroscience meeting in San Diego. It was a great opportunity for the team to connect with neuroscientists across a range of backgrounds as we continue to improve and apply our technology.
In this post, we provide some additional information and clarification on our poster presenting preclinical results of neural signal stability in the ovine model, based on feedback from the meeting. In presenting the poster, our conversations at SfN centered on the core issue of whether BCIs can perform reliably over the long term.
Long-term reliability is one of the essential requirements for creating a robust BCI platform. In our experience, future BCI users do not want to be locked into a two-year cycle of neurosurgical procedures to replace failing devices. We therefore took device longevity as an ethical (and commercial) imperative for our platform, and our commitment begins with our very first product, which is designed to restore speech, communication and independence for people who need it the most.
Specifically, we have been tracking two important device characteristics: recording quality and decoding performance. We track recording quality, specifically signal-to-noise ratio (SNR) in the action potential band, because the gradual loss of signal in traditional intracortical recordings is most commonly attributed to degradation of electrode insulation, electrode fouling, and gliosis, all of which cause attenuation of neural signals. Decaying SNR is a leading indicator for loss of decoding performance, and whereas decoding based metrics may be subject to ceiling effects (especially for low complexity tasks), SNR can be continuously tracked from day one.
We also rigorously measure end-to-end system performance by calculating information transfer rates in bits per second and delay in milliseconds. This is where the rubber hits the road. In our preclinical case, our device is implanted in sheep auditory cortex, and performance is evaluated with an auditory decoding task. In our clinical application, the device will be implanted in human motor cortex, and it will be used to translate imagined speech and other language correlates into communication.
At SfN, we reported on the cohort of sheep that were implanted with our Connexus BCI—the same device that will be used in our upcoming clinical trial. We are pleased to report a stable SNR of ~4, which is as good or better than published for chronically implanted Utah Arrays in the rhesus macaque motor cortex (from 1.5 to 4; Sponheim et al. 2021). This is backed by consistent decoding performance, as quantified by information transfer rates.
But the flow of information at SfN wasn’t just one-way. We benefited a lot from community feedback on the poster.
While the community was enthusiastic about our signal stability as measured by SNR, our discussions at the Society for Neuroscience highlighted critical additional measures needed to contextualize these findings. In summary, a complete demonstration of stability requires the additional assessment of consistency in the number of spiking events detected, the total number of spike-bearing channels over time, and stability of background noise. As demonstrated in more detail below, we find that each of these measures also remains consistent, reinforcing the strength, durability, and integrity of Paradromics’ BCI recordings.
Another specific concern about using SNR as a stability metric is that it can be subject to day-to-day signal processing decisions surrounding how signals and noise are defined and detected. While this can be done objectively, rigorously, and consistently, it is an easier metric to “cheat” than, for instance, decoding performance. A more direct way to assess meaningful stability is to tie our analysis to stimulus-driven neural activity, which gives us a ground-truth and a powerful single output metric: decoding performance. Furthermore, because we have designed our SONIC benchmarking protocol to maximize information transfer by using a high complexity stimulus, it has a much higher measurement ceiling than low complexity tasks, such as cursor control. This means that it is more sensitive to signal degradation and early signs of degradation won’t be masked by threshold effects.
As indicated in the SfN poster linked at the bottom, we also report consistent decoding accuracy with the Connexus BCI using a slower acoustic stimulus paradigm, even for our highest bandwidth tests.
Signal-to-Noise Ratio (SNR) is one important metric demonstrating signal stability
Signal to noise ratio (SNR) quantifies a sensor’s ability to detect a signal of interest. In the context of the Connexus intracortical array, the signals to detect are the peak of the extracellular action potentials, or “spikes” in the neural signals in the spiking frequency band (200 Hz to 2.2 kHz), and noise is the root-mean-square (RMS) amplitude of the background voltage signal. We define the SNR for spiking signals (Figure 1) as the average peak-to-peak amplitude of spikes detected at amplitudes exceeding 4.5X the background RMS amplitude, divided by twice that background amplitude. A low SNR means these events are barely distinguishable from the background noise, and depending on the RMS threshold used for spike detection, false detections are likely. A high SNR means that the spiking events are obvious compared to the background noise, and it is possible to separate signal and noise with high fidelity.
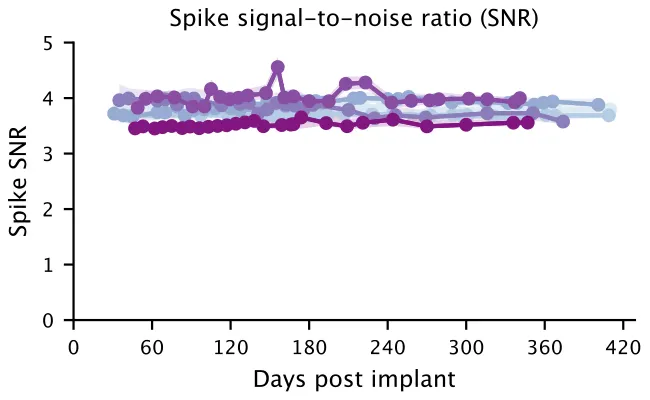
Figure 1: Median SNR at 4.5X spike detection threshold for six Connexus arrays implanted for about 1 year.
The number of spike detection thresholds and channel counts also remains stable
However, there is a chicken-and-egg scenario in this notion of SNR. Because spikes are detected by identifying signals that cross an RMS threshold, there is already a high bar for a signal to be counted in the SNR numerator. The minimum signal that counts towards SNR is 4.5X RMS and the noise denominator is 2X RMS, so the minimum possible SNR is 2.25X for a channel that only detects at-threshold spikes. The median SNR value for each Connexus array always exceeds that level by more than one point. Another analysis choice we make is to report results from a set of signals that we have high confidence about. Therefore, this SNR is aggregated only from channels that record robustly spiking neural signals (channel counts are shown in Figure 2).
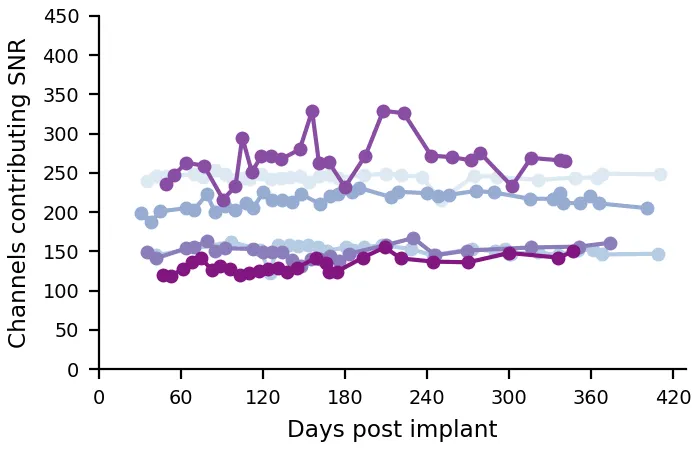
Figure 2: Number of channels recording robust neural activity above a 4.5X spike detection threshold for six Connexus arrays implanted for about 1 year. The variance in the channel counts is related to differences in surgical access, which affected the size, shape, and location of the exposed cortex. In the sheep brain, the full implant area included gyri and vasculature to varying degrees, which affected how many electrodes could sense intrinsic neural signals.
Consistent firing rates and background noise levels were observed, further supporting signal stability
SNR is a convenient single-number summary of the quality of the spiking signal, but it obscures some detail by merging complex signal detection and noise information into one metric. We can take a step back and consider the inputs prior to channel selection and spike threshold detection. The signal detections themselves are a function of spike-band RMS voltage, or the background signal amplitude on each channel. The mean spike-band RMS voltage (Figure 3, top) aggregates the background signal level across all functional channels on each array. These series reveal a steady or slightly decreasing baseline level for signal detection for each array, indicating that both the noise and signal detection levels remain consistent across time.
One caveat to the interpretation of the longitudinal SNR plot is that we may be searching under the streetlight. Namely, the apparent spike SNR could theoretically remain high over time even if the distribution of spike amplitudes is decreasing relative to noise, merely because the plot includes only those spikes that cross the amplitude threshold. To rule out this possibility, we looked at the rates of those threshold crossings to check whether they are decreasing over the same timescales; if so, this would be consistent with a decreasing number of spiking events and/or spike-bearing channels over time. We find that the longitudinal series of mean firing rates at the 4.5X threshold (Figure 3, bottom) remains approximately level, supporting the hypothesis that spike amplitudes remain stable over time. Combined, these data increase our confidence in the stability of spiking signals over time.
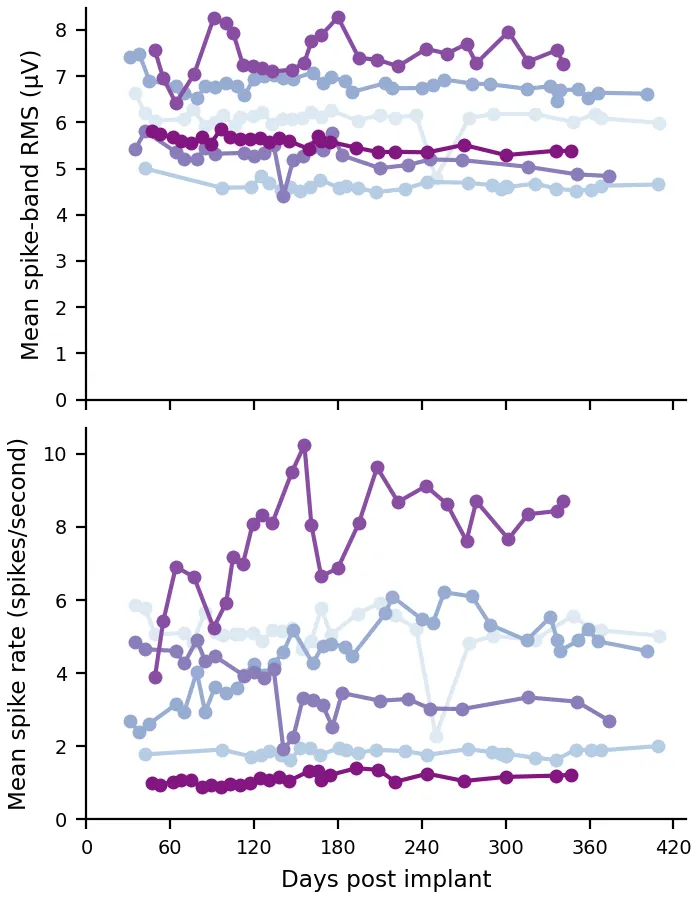
Figure 3, top: RMS amplitude of the background signal, averaged across all functional channels; and (bottom) rate of spiking at a 4.5X detection threshold, averaged across all functional channels for six Connexus arrays implanted for about 1 year.
Summary: Spiking signal quality, background noise levels and SNR each remain strong and stable
Median signal to noise ratio consistently exceeds the minimum theoretical value imposed by the detection method, indicating that extracellular spikes are clearly separable from background activity. When separately evaluating the signal (numerator) and noise (denominator), we find that the noise shows a steady or mildly decreasing background level across arrays, suggesting stable noise conditions and consistent signal detectability.
Importantly, mean firing rates at the same detection threshold remain approximately constant over time, addressing concerns that stable SNR could arise from selective thresholding. Together, these measures support the conclusion that both spike amplitudes and detection rates are maintained over long implantation periods, reflecting durable and reliable spiking signal performance.
While SNR and the accompanying measurements provide a critical demonstration of stable recordings, we note that decoding-based analysis of stimulus-driven neural activity can provide one of the most powerful aggregate measures of recording consistency. Importantly, we demonstrate that stable decoding accuracy is also present in our recordings, as reported in the SfN poster, further supporting durable and reliable long-term BCI performance.
Why track SNR if decoding accuracy is what matters?
Why not just measure bps? Why bother measuring SNR at all? Ultimately, for the user, that is what matters. The answer is that SNR can be measured and tracked in a way that is not task dependent and thus allows for tracking of signal quality in a way that is 1) independent of stimulus or task design and 2) more easily compared across studies in dissimilar experimental paradigms.
This is most important when device performance is being evaluated using a low complexity task. For instance, the first Neuralink implant in clinical trials had 85% of its electrodes retract from the brain in the first few months, but because cursor control is a relatively low complexity task, they were able to maintain adequate performance by changing decoding strategy after the event. This is great from a functional perspective. You have to work with the signal you have—not the signal you want. However, when assessing stability for purposes of improving the platform, using decoding based metrics in the absence of signal quality metrics could mask early issues.
Click here for a closer look at the poster, and watch this space for a deeper dive into our second SfN poster featuring our SONIC benchmarking results.
Follow Matt Angle on Substack for more.